
How to Look Up Plymouth County Jail Population Data
There is no single live dashboard for the county jail count. The reliable numbers live in official reports that update on their own schedule. Three sources carry most of the data: the Sheriff's Department, the Massachusetts Sheriffs' Association, and the federal Bureau of Justice Statistics for national context.
To read this data well, start with the most recent official report and note its date.
- The Plymouth County Sheriff's Department budget and annual materials.
- Massachusetts Sheriffs' Association annual reports on county jails.
- Bureau of Justice Statistics jail reports for national figures.
- State budget line items for the sheriff's correctional operations.
Because these reports update at different times, always check the year before you compare figures.
Plymouth County Jail Capacity Overview
Capacity is the number of beds a facility is built and rated to hold. The Plymouth County Correctional Facility serves as the county jail for both pretrial detainees and county-sentenced inmates. A current, exact capacity figure should be taken from the latest official sheriff or Sheriffs' Association report rather than an estimate.
| Facility | Type | Capacity | Source |
|---|---|---|---|
| Plymouth County Correctional Facility | County jail and correctional facility | Confirm from the latest PCSD or MSA annual report | Sheriff and Sheriffs' Association |
When a published capacity number is given, check whether it counts rated beds, operational beds, or both, since those can differ. A facility can run near, at, or over its rated capacity depending on intake, and that gap is part of what crowding measures track.
Average Daily Population
Average daily population, often shortened to ADP, is the mean number of people held across a period. It smooths out day-to-day swings and is the standard way to compare a jail over time. ADP rises and falls with arrests, court speed, bail decisions, and sentencing.
An exact Plymouth County ADP should come from the most recent official report. A single roster count is not an ADP, because one day is not an average. For the individual side of these counts, see the Plymouth County inmate records page.
Demographic Breakdown
Demographic data describes the population by age, sex, and race or ethnicity. County jails count these internally, but a public, detailed breakdown is not always published, so use the latest official report for any figure. County-wide population context, which helps frame jail data, comes from the U.S. Census.
The official Census QuickFacts page for Plymouth County is shown below.
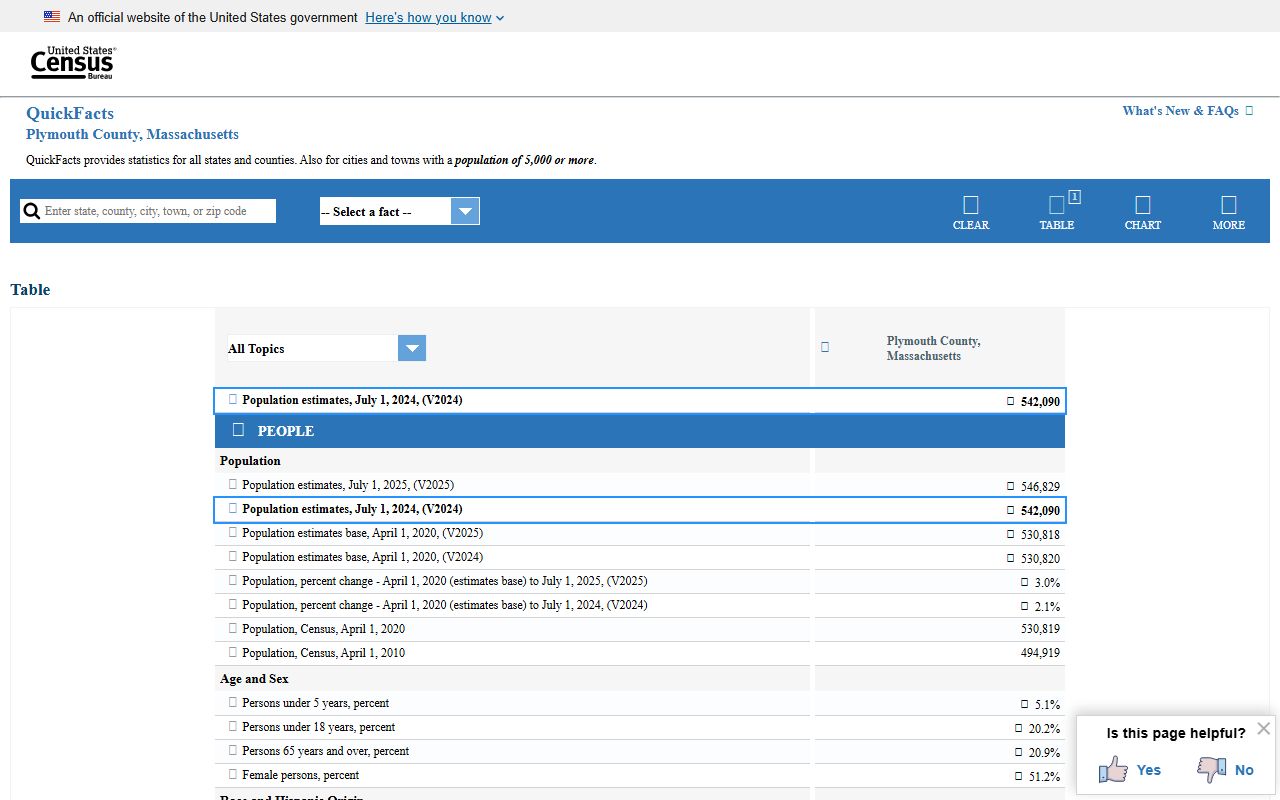
Census figures describe the whole county, not the jail, so keep the two separate when you read them.
Pretrial vs Sentenced Population
A county jail holds two broad groups, and the split matters. Pretrial detainees are held while a case is pending, often because they cannot post bail. Sentenced inmates are serving a county sentence after a conviction. The table below sets the two apart.
| Point | Pretrial | Sentenced |
|---|---|---|
| Status | Case still pending | Convicted and serving |
| Why held | Bail, detention, or a hold | A county sentence |
| Release driver | Bail, dismissal, or case end | Sentence completion |
A high pretrial share often reflects bail and case-processing speed more than crime rates. The exact split for Plymouth County belongs in the latest official report.
Misdemeanor vs Felony Population
The mix of charges also shapes the count. Misdemeanors are lower-level offenses, while felonies are more serious. A felony case is more likely to move to Superior Court and to carry a longer hold. The jail count reflects both groups, plus people held on warrants and detainers.
Charge-level breakdowns, where published, come from the sheriff or state reports. A roster snapshot can hint at the mix, but it is not a reliable measure of it.
Holds, Detainers, and Transfers
Not everyone in the count is there on a single Plymouth County case. The population also includes people held on warrants from other courts, on probation detainers, and on state or federal detainers. Transfers in and out of the facility shift the number too.
This is why a raw count can mislead. A person held on a detainer is in the jail but may belong to another system's case. Official reports separate these groups so the figures mean what they appear to mean. When you read a count, ask what it includes before you draw a conclusion.
Program and Classification Population
Within the count, people are sorted by classification and program participation. Work assignments, education, treatment, religious services, and reentry programs each draw a share of the population. These program numbers, where reported, come from the sheriff.
Program participation is not just a statistic. It affects housing, staffing, and the daily routine of the facility, which is why official reports track it alongside the raw counts.
Mental Health and Medical Population
Jails hold a meaningful share of people with mental-health and medical needs. The facility screens for these needs at intake and provides care, but individual medical status is never public. Counts of the medical or mental-health population, where reported, are internal figures that may appear in official reports in aggregate form.
This population affects staffing, housing, and program demand, which is one reason official reports track it at a high level rather than naming anyone.
National and State Context
To judge whether a county number is high or low, you need a benchmark. The Bureau of Justice Statistics publishes national jail data, including pretrial detention and admissions, that serves as a comparison point. The Vera Institute also tracks incarceration trends and can supplement official data, though official sources come first.
The table below shows where each level of data lives. Exact rates per 100,000 should be pulled from the current reports rather than estimated.
| Level | Source | What It Provides |
|---|---|---|
| County | Sheriff and MSA reports | Capacity, ADP, and local splits |
| State | State budget and MSA | Statewide county jail figures |
| National | Bureau of Justice Statistics | National jail rates and trends |
Comparing the same measure across levels is the only fair comparison, so match ADP to ADP and rate to rate. Mixing a daily count with an annual average will give a misleading result every time.
Population Trends Over Time
Jail counts move with the world around them. Many Massachusetts county jail populations fell during the early COVID-19 period as courts slowed, then shifted again as operations resumed. Bail reform, diversion programs, and case backlogs all push the number up or down.
A trend line for Plymouth County should be built only from official figures across comparable years. A single year, or a single day, does not show a trend. Read several reports in a row to see the real direction.
Budget and Staffing Context
Population data sits next to budget and staffing in the official reports. The Sheriff's Department budget, state correctional line items, and Sheriffs' Association reports show what it costs to run the facility and how it is staffed. These figures help explain why population matters beyond a simple head count.
One caution: do not infer an officer-to-inmate ratio from a roster count. Staffing levels come from official figures, not from guessing. For the most accurate picture, pair the population data with the same year's budget report. A single-year view rarely tells the whole story.
Searching for Plymouth County Inmate Records by Name
This page covers population data, not individual records. To look up a specific person, use the Plymouth County inmate records page, which explains the jail roster, VINELink, and the state and federal locators. To confirm a release, use the released inmates page.
Where the Data Comes From
Reliable jail population data starts with official reports. The Sheriff's Department and the Massachusetts Sheriffs' Association report on county operations, programs, funding, and population. State budget documents add fiscal context. The Bureau of Justice Statistics frames the national picture.
Note: Specific Plymouth County capacity, daily population, and demographic figures should be taken from the most recent official sheriff or state report, since they change over time.